📊 Acadezi Statistics Solutions
Chapters 1-3 | Complete Step-by-Step Solutions
📝 Chapter 1: Introduction to Statistics
Question 1
A survey of 320 elementary pupils found that 30% are classified as obese.
🔍 View Solution
a. Sample: 320 elementary pupils surveyed
b. Population: All elementary pupils
b. Population: All elementary pupils
Question 2
A survey of 1200 Acadezi students found that 48% will apply for bachelor degree.
🔍 View Solution
a. Sample: 1200 Acadezi students surveyed
b. Population: All Acadezi students
b. Population: All Acadezi students
Question 3
The average age of all students in a university is 28 years.
🔍 View Solution
Parameter (describes entire population)
Question 4
The average age of 350 students taken from 10,000 students is 26 years.
🔍 View Solution
Statistic (describes a sample)
Question 5
The average salary of 2000 graduates is $95,000.
🔍 View Solution
Statistic (based on 2000 graduates, not all)
Question 6
The average age of students in a statistics class is 22 years.
🔍 View Solution
Descriptive Statistics
Question 7
Based on previous clients, an agent concludes that the majority of marriages that begin with cohabitation before marriage will result in divorce.
🔍 View Solution
Inferential Statistics
Question 8
The color of an automobile.
🔍 View Solution
Qualitative
Question 9
a) The number of seats in a movie theater.
b) The number on a seat in a movie theater.
b) The number on a seat in a movie theater.
🔍 View Solution
a) Quantitative (countable)
b) Qualitative (label)
b) Qualitative (label)
Question 10
A sample of adults suffering from diabetes receive medication. At the end of three months, the patients' symptoms are evaluated.
🔍 View Solution
Experiment
Question 11
The effect a severe earthquake would have on the Salt Lake Valley.
🔍 View Solution
Simulation
Question 12
The director at a company calls employees and asks them about their lunch habits.
🔍 View Solution
Survey
Question 13
A study of attention-deficit/hyperactivity disorder in preschool children.
🔍 View Solution
Observational Study
Question 14
Identify the sampling technique used:
🔍 View Solution
a) Every fifth person boarding a plane searched → Systematic
b) 5 classes randomly selected, all students interviewed → Cluster
c) Assign numbers, generate random numbers → Simple Random
d) Randomly choose 10 zip codes, survey all households → Cluster
e) Random ID, then every 10th student → Systematic
b) 5 classes randomly selected, all students interviewed → Cluster
c) Assign numbers, generate random numbers → Simple Random
d) Randomly choose 10 zip codes, survey all households → Cluster
e) Random ID, then every 10th student → Systematic
📈 Chapter 2: Descriptive Statistics
Question 1
Given frequency distribution:
| Class | Frequency, f |
|---|---|
| 50 - 52 | 5 |
| 53 - 55 | 8 |
| 56 - 58 | 12 |
| 59 - 61 | 13 |
| 62 - 64 | 11 |
🔍 View Solution
a) Class width: 3
b) Sample size: 5 + 8 + 12 + 13 + 11 = 49
c) Midpoint of first class: (50 + 52)/2 = 51
d) Boundaries of second class: 52.5 - 55.5
e) Relative frequency of last class: 11/49 ≈ 0.2245
b) Sample size: 5 + 8 + 12 + 13 + 11 = 49
c) Midpoint of first class: (50 + 52)/2 = 51
d) Boundaries of second class: 52.5 - 55.5
e) Relative frequency of last class: 11/49 ≈ 0.2245
Question 2
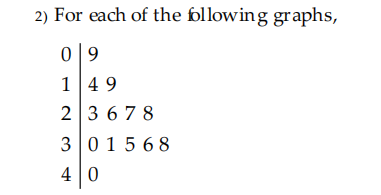
For the stem-and-leaf plot:
📊 Graph 1 - Stem Plot
🔍 View Solution
a) Sample size: 14
b) Mean: (9+14+19+23+26+27+28+30+31+35+36+38+40)/14 = 336/14 = 24
c) Median: (27+28)/2 = 27.5
d) Maximum: 40
e) Minimum: 9
f) Range: 40 - 9 = 31
b) Mean: (9+14+19+23+26+27+28+30+31+35+36+38+40)/14 = 336/14 = 24
c) Median: (27+28)/2 = 27.5
d) Maximum: 40
e) Minimum: 9
f) Range: 40 - 9 = 31
Question 2b
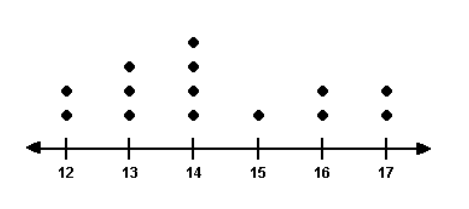
For the number line plot:
📊 Graph 2 - Number Line
🔍 View Solution
a) Sample size: 14
b) Mean: (12+12+13+13+13+14+14+14+14+15+16+16+17+17)/14 = 100/7
c) Median: 14
d) Maximum: 17
e) Minimum: 12
f) Range: 17 - 12 = 5
b) Mean: (12+12+13+13+13+14+14+14+14+15+16+16+17+17)/14 = 100/7
c) Median: 14
d) Maximum: 17
e) Minimum: 12
f) Range: 17 - 12 = 5
Question 3
Find the range for each data set:
🔍 View Solution
a) 0.3, 0.8, 2.3, 8.5, 2.5, 1.3, 5.4
Range = 8.5 - 0.3 = 8.2
b) 12, 7, 15, -2, -6, 18, 10
Range = 18 - (-6) = 24
Range = 8.5 - 0.3 = 8.2
b) 12, 7, 15, -2, -6, 18, 10
Range = 18 - (-6) = 24
Question 4
If the mean is 17 and the median is 12, then the shape of the distribution is:
🔍 View Solution
Mean (17) > Median (12) → Skewed Right
Question 5
For the data set: 4, 15, 10, 8, 20, 25, 43, 40, 36, 46
🔍 View Solution
Sorted: 4, 8, 10, 15, 20, 25, 36, 40, 43, 46
a) Mean: 247/10 = 24.7
Median: (20 + 25)/2 = 22.5
Mode: No mode
b) Shape: Mean > Median → Skewed Right
a) Mean: 247/10 = 24.7
Median: (20 + 25)/2 = 22.5
Mode: No mode
b) Shape: Mean > Median → Skewed Right
Question 6
Create a stem-and-leaf plot for: 4, 15, 10, 8, 20, 25, 43, 40, 36, 46, 39
🔍 View Solution
0 | 4 8
1 | 0 5
2 | 0 5
3 | 6 9
4 | 0 3 6
Question 7
Create a stem-and-leaf plot for: 114, 107, 125, 139, 119, 120, 131, 100, 124
🔍 View Solution
10 | 0 7
11 | 4 9
12 | 0 4 5
13 | 1 9
Question 8
A student receives scores: Midterm=62 (25%), Project=92 (15%), Final=88 (35%), Homework=76 (25%). Find the weighted mean.
🔍 View Solution
Weighted mean = 62(0.25) + 92(0.15) + 88(0.35) + 76(0.25)
= 15.5 + 13.8 + 30.8 + 19 = 79.1
= 15.5 + 13.8 + 30.8 + 19 = 79.1
Question 9
Which data set has the greatest and which has the least standard deviation?
📊 Standard Deviation Comparison

🔍 View Solution
(A) Greatest standard deviation: Data set with most spread (widest range)
(c) Least standard deviation: Data set with least spread (most clustered)
(c) Least standard deviation: Data set with least spread (most clustered)
Question 10
Find the population standard deviation: 2, 6, 9, 11, 8, 18
🔍 View Solution
Mean = 54/6 = 9
Variance = [(2-9)²+(6-9)²+(9-9)²+(11-9)²+(8-9)²+(18-9)²]/6
= [49+9+0+4+1+81]/6 = 144/6 = 24
Standard deviation = √24 = 4.899
Variance = [(2-9)²+(6-9)²+(9-9)²+(11-9)²+(8-9)²+(18-9)²]/6
= [49+9+0+4+1+81]/6 = 144/6 = 24
Standard deviation = √24 = 4.899
Question 11
Find the sample variance and standard deviation: 12, 18, 10, 7, 8
🔍 View Solution
Mean = 55/5 = 11
Sample variance = [(1)²+(7)²+(-1)²+(-4)²+(-3)²]/4
= [1+49+1+16+9]/4 = 76/4 = 19
Sample standard deviation = √19 = 4.359
Sample variance = [(1)²+(7)²+(-1)²+(-4)²+(-3)²]/4
= [1+49+1+16+9]/4 = 76/4 = 19
Sample standard deviation = √19 = 4.359
Question 12
The mean score of a math test is 65, with a standard deviation of 4. Assuming a bell-shaped distribution, find the percentage of scores between 53 and 77.
🔍 View Solution
z₁ = (53-65)/4 = -3
z₂ = (77-65)/4 = 3
By the Empirical Rule: 99.7% of data falls within ±3 standard deviations
z₂ = (77-65)/4 = 3
By the Empirical Rule: 99.7% of data falls within ±3 standard deviations
Question 13
For the data set: 18, 24, 23, 10, 15, 28, 5, 30, 27, 4, 54, 50, 12
🔍 View Solution
Sorted: 4,5,10,12,15,18,23,24,27,28,30,50,54
Five-number summary:
Min = 4
Q₁ = (10+12)/2 = 11
Median = 23
Q₃ = (28+30)/2 = 29
Max = 54
IQR = 29 - 11 = 18
Five-number summary:
Min = 4
Q₁ = (10+12)/2 = 11
Median = 23
Q₃ = (28+30)/2 = 29
Max = 54
IQR = 29 - 11 = 18
Question 14
For the data set: 18, 24, 23, 10, 15, 28, 5, 30, 27, 4, 54, 50
🔍 View Solution
Sorted: 4,5,10,15,18,23,24,27,28,30,50,54
Five-number summary:
Min = 4
Q₁ = (10+15)/2 = 12.5
Median = (23+24)/2 = 23.5
Q₃ = (28+30)/2 = 29
Max = 54
IQR = 29 - 12.5 = 16.5
Five-number summary:
Min = 4
Q₁ = (10+15)/2 = 12.5
Median = (23+24)/2 = 23.5
Q₃ = (28+30)/2 = 29
Max = 54
IQR = 29 - 12.5 = 16.5
Question 15
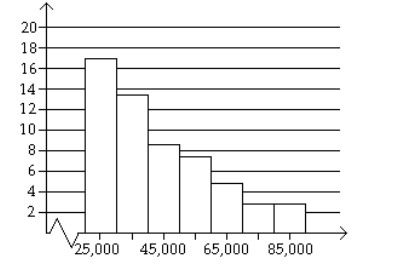
Consider the following histogram and determine its shape.
📊 Histogram
🔍 View Solution
a) Shape of distribution: Skewed Right
b) Relationship: Mean > Median
Note: Based on typical histogram shape with tail to the right.
b) Relationship: Mean > Median
Note: Based on typical histogram shape with tail to the right.
Question 16
If mean = 4 and median = 7, then the shape of the distribution is:
🔍 View Solution
Mean (4) < Median (7) → Skewed Left
Question 17
The shape of the distribution for the data set: 7, 12, 17, 24, 29, 32, 40 is:
🔍 View Solution
Mean = 161/7 ≈ 23, Median = 24
Mean (23) < Median (24) → Skewed Left
Mean (23) < Median (24) → Skewed Left
Question 18
Consider the stem-and-leaf plot: 0|9, 1|4, 2|3 6, 3|0 1 5, 4|2
🔍 View Solution
Data: 9,14,23,26,30,31,35,42
Mean = 210/8 = 26.25, Median = (26+30)/2 = 28
Mean < Median → Skewed Left
For this shape: mean < median
Mean = 210/8 = 26.25, Median = (26+30)/2 = 28
Mean < Median → Skewed Left
For this shape: mean < median
🎲 Chapter 3: Probability
Question 1
"The probability that a train will be in an accident is 0.01."
🔍 View Solution
Empirical Probability (based on historical data)
Question 2
"The probability that a newborn baby is a boy is 0.5."
🔍 View Solution
Classical Probability (equally likely outcomes)
Question 3
Roll a six-sided die. Find the probability of rolling a number less than 5.
🔍 View Solution
Numbers less than 5: {1,2,3,4} → 4 outcomes
Probability = 4/6 = 2/3
Probability = 4/6 = 2/3
Question 4
Roll a six-sided die. Find the probability of rolling a number greater than 5.
🔍 View Solution
Numbers greater than 5: {6} → 1 outcome
Probability = 1/6
Probability = 1/6
Question 5
Roll a six-sided die. Find the probability of rolling a seven.
🔍 View Solution
0 (impossible event - die only has numbers 1-6)
Question 6
Draw a card from a standard deck of 52 cards. Find the probability of drawing an ace.
🔍 View Solution
4 aces in 52 cards → 4/52 = 1/13
Question 7
Draw a card from a standard deck. Find the probability of drawing a heart.
🔍 View Solution
13 hearts → 13/52 = 1/4
Question 8
Draw a card from a standard deck. Find the probability of drawing a picture card (Jack, Queen, King).
🔍 View Solution
Picture cards: J, Q, K (3 per suit × 4 suits = 12)
Probability = 12/52 = 3/13
Probability = 12/52 = 3/13
Question 9
Draw a card from a standard deck. Find the probability of drawing a number less than 5 (Ace counts as 1).
🔍 View Solution
Numbers: Ace(1),2,3,4 in each suit → 4 cards × 4 suits = 16 cards
Probability = 16/52 = 4/13
Probability = 16/52 = 4/13
Question 10
A bag contains 5 red balls, 7 blue balls, and 13 green balls. Find the probability that a randomly selected ball is NOT blue.
🔍 View Solution
Total balls = 5 + 7 + 13 = 25
Not blue = red + green = 5 + 13 = 18
Probability = 18/25
Not blue = red + green = 5 + 13 = 18
Probability = 18/25
Question 11
From the table, find the probability that a randomly selected student has a major of Business.
| Major | Number |
|---|---|
| Mathematics | 16 |
| English | 20 |
| Engineering | 60 |
| Business | 114 |
| Education | 100 |
🔍 View Solution
Total students = 16 + 20 + 60 + 114 + 100 = 310
P(Business) = 114/310 = 57/155 ≈ 0.3677
P(Business) = 114/310 = 57/155 ≈ 0.3677
Question 12
From the table, find the probability that a randomly selected student has a major of Mathematics.
| Major | Number |
|---|---|
| Mathematics | 16 |
| English | 20 |
| Engineering | 60 |
| Business | 114 |
| Education | 100 |
🔍 View Solution
Total students = 310
P(Mathematics) = 16/310 = 8/155 ≈ 0.0516
P(Mathematics) = 16/310 = 8/155 ≈ 0.0516
Question 13
Find the probability that a randomly selected person has blood type A+.
| Blood Type | Number |
|---|---|
| O+ | 37 |
| O- | 6 |
| A+ | 34 |
| A- | 6 |
| B+ | 10 |
| B- | 2 |
| AB+ | 4 |
| AB- | 1 |
🔍 View Solution
Total people = 37 + 6 + 34 + 6 + 10 + 2 + 4 + 1 = 100
Number with A+ = 34
P(A+) = 34/100 = 0.34
Number with A+ = 34
P(A+) = 34/100 = 0.34
Question 14
Given P(A)=0.8, P(B)=0.2, and P(A and B)=0.16. Classify the events as dependent or independent.
🔍 View Solution
Check: P(A) × P(B) = 0.8 × 0.2 = 0.16 = P(A and B)
Since P(A and B) = P(A) × P(B), events are Independent
Since P(A and B) = P(A) × P(B), events are Independent
Question 15
Two cards are drawn from a deck with replacement. Classify as dependent or independent.
🔍 View Solution
With replacement means the first card is returned to the deck
Therefore, events are Independent
Therefore, events are Independent
Question 16
Two cards are drawn without replacement. Find P(second card is Ace | first card is Jack).
🔍 View Solution
After drawing a Jack, 51 cards remain, all 4 Aces are still there
Probability = 4/51
Probability = 4/51
Question 17
Two cards are drawn without replacement. Find P(first card is Jack AND second card is King).
🔍 View Solution
P(Jack first) = 4/52
P(King second | Jack first) = 4/51
Probability = (4/52) × (4/51) = 16/2652 = 4/663
P(King second | Jack first) = 4/51
Probability = (4/52) × (4/51) = 16/2652 = 4/663
Question 18
Two cards are drawn without replacement. Find the probability of selecting TWO ACES.
🔍 View Solution
P(1st Ace) = 4/52
P(2nd Ace | 1st Ace) = 3/51
Probability = (4/52) × (3/51) = 12/2652 = 1/221
P(2nd Ace | 1st Ace) = 3/51
Probability = (4/52) × (3/51) = 12/2652 = 1/221
Question 19
Two cards are drawn without replacement. Find the probability of selecting TWO HEARTS.
🔍 View Solution
P(1st Heart) = 13/52
P(2nd Heart | 1st Heart) = 12/51
Probability = (13/52) × (12/51) = 156/2652 = 1/17
P(2nd Heart | 1st Heart) = 12/51
Probability = (13/52) × (12/51) = 156/2652 = 1/17
Question 20
Given P(A)=0.8, P(B)=0.2, and P(A and B)=0. Decide if events A and B are mutually exclusive.
🔍 View Solution
P(A and B) = 0 means events cannot occur simultaneously
Therefore, events are Mutually Exclusive
Therefore, events are Mutually Exclusive
Question 21
A die is rolled. Event A: The result is an odd number. Event B: The result is a number less than 3. Determine if mutually exclusive.
🔍 View Solution
A = {1,3,5}, B = {1,2}
Intersection = {1} → not empty
Therefore, events are Not Mutually Exclusive
Intersection = {1} → not empty
Therefore, events are Not Mutually Exclusive
Question 22
Roll a die. Find the probability of rolling a number greater than 3 or an even number.
🔍 View Solution
A = {4,5,6} (greater than 3)
B = {2,4,6} (even)
A∪B = {2,4,5,6} → 4 outcomes
Probability = 4/6 = 2/3
B = {2,4,6} (even)
A∪B = {2,4,5,6} → 4 outcomes
Probability = 4/6 = 2/3
Question 23
Roll a die. Find the probability of rolling a number greater than 5 or an odd number.
🔍 View Solution
A = {6} (greater than 5)
B = {1,3,5} (odd)
A∪B = {1,3,5,6} → 4 outcomes
Probability = 4/6 = 2/3
B = {1,3,5} (odd)
A∪B = {1,3,5,6} → 4 outcomes
Probability = 4/6 = 2/3
Question 24
Draw a card from a deck. Find the probability of drawing a king or a heart.
🔍 View Solution
P(King) = 4/52
P(Heart) = 13/52
P(King and Heart) = 1/52 (King of Hearts)
P(King or Heart) = 4/52 + 13/52 - 1/52 = 16/52 = 4/13
P(Heart) = 13/52
P(King and Heart) = 1/52 (King of Hearts)
P(King or Heart) = 4/52 + 13/52 - 1/52 = 16/52 = 4/13
Question 25
Draw a card from a deck. Find the probability of drawing a king or a jack.
🔍 View Solution
Kings: 4, Jacks: 4, mutually exclusive (no card is both)
Probability = (4 + 4)/52 = 8/52 = 2/13
Probability = (4 + 4)/52 = 8/52 = 2/13
Question 26
From the table, find the probability that a randomly selected student is a freshman.
| Class | Own a car | Not Own a Car | Total |
|---|---|---|---|
| Freshman | 43 | 17 | 60 |
| Sophomore | 21 | 19 | 40 |
| Total | 64 | 36 | 100 |
🔍 View Solution
Total freshmen = 43 + 17 = 60
Total students = 100
P(Freshman) = 60/100 = 3/5
Total students = 100
P(Freshman) = 60/100 = 3/5
Question 27
From the table, find P(owns a car | student is a freshman).
| Class | Own a car | Not Own a Car | Total |
|---|---|---|---|
| Freshman | 38 | 22 | 60 |
| Sophomore | 31 | 9 | 40 |
| Total | 69 | 31 | 100 |
🔍 View Solution
Freshmen who own a car = 38
Total freshmen = 60
P(owns car | freshman) = 38/60 = 19/30
Total freshmen = 60
P(owns car | freshman) = 38/60 = 19/30
Question 28
From the table, find P(freshman | owns a car).
| Class | Own a car | Not Own a Car | Total |
|---|---|---|---|
| Freshman | 29 | 31 | 60 |
| Sophomore | 40 | 0 | 40 |
| Total | 69 | 31 | 100 |
🔍 View Solution
Freshmen who own a car = 29
Total who own a car = 69
P(freshman | owns car) = 29/69
Total who own a car = 69
P(freshman | owns car) = 29/69
Question 29
From the table, find P(freshman or owns a car).
| Class | Own a car | Not Own a Car | Total |
|---|---|---|---|
| Freshman | 31 | 29 | 60 |
| Sophomore | 20 | 20 | 40 |
| Total | 51 | 49 | 100 |
🔍 View Solution
P(Freshman) = 60/100
P(Owns car) = 51/100
P(Freshman and Owns car) = 31/100
P(Freshman or Owns car) = 60/100 + 51/100 - 31/100 = 80/100 = 4/5
P(Owns car) = 51/100
P(Freshman and Owns car) = 31/100
P(Freshman or Owns car) = 60/100 + 51/100 - 31/100 = 80/100 = 4/5
Question 30
How many different 4-digit codes are possible if each digit can be used only once?
🔍 View Solution
10 × 9 × 8 × 7 = 5040 possible codes
Question 31
How many different 4-digit codes are possible if digits can be repeated and the code cannot end in 0?
🔍 View Solution
First 3 digits: 10 choices each = 10³ = 1000
Last digit: 9 choices (1-9)
Total = 1000 × 9 = 9000
Last digit: 9 choices (1-9)
Total = 1000 × 9 = 9000
Question 32
How many different 4-digit codes are possible if digits can be repeated, the first digit must be 1, 3, or 5, and the code cannot end in 0 or 1?
🔍 View Solution
First digit: 3 choices (1,3,5)
Middle two digits: 10 × 10 = 100
Last digit: exclude 0 and 1 → 8 choices (2-9)
Total = 3 × 100 × 8 = 2400
Middle two digits: 10 × 10 = 100
Last digit: exclude 0 and 1 → 8 choices (2-9)
Total = 3 × 100 × 8 = 2400
Question 33
How many different 5-digit codes are possible if digits can be repeated, the first digit can only be 8 or 9, and the code cannot end in 3?
🔍 View Solution
First digit: 2 choices (8,9)
Middle three digits: 10³ = 1000
Last digit: exclude 3 → 9 choices
Total = 2 × 1000 × 9 = 18000
Middle three digits: 10³ = 1000
Last digit: exclude 3 → 9 choices
Total = 2 × 1000 × 9 = 18000
Question 34
How many different 5-digit codes are possible if digits can be repeated, the first digit must be 9, and the code cannot end in 1, 3, 5, or 7?
🔍 View Solution
First digit: 1 choice (9)
Middle three digits: 10³ = 1000
Last digit: exclude 1,3,5,7 → 6 choices (0,2,4,6,8,9)
Total = 1 × 1000 × 6 = 6000
Middle three digits: 10³ = 1000
Last digit: exclude 1,3,5,7 → 6 choices (0,2,4,6,8,9)
Total = 1 × 1000 × 6 = 6000
Question 35
A delivery route includes eight cities. How many different routes are possible?
🔍 View Solution
8! = 8 × 7 × 6 × 5 × 4 × 3 × 2 × 1 = 40320
Question 36
A student board consists of 17 members. Three members are chosen to serve as chair, secretary, and webmaster. How many ways can the three members be chosen?
🔍 View Solution
Order matters (different positions)
17 × 16 × 15 = 4080
17 × 16 × 15 = 4080
Question 37
A car race consists of 20 cars. How many ways can the cars finish first, second, third, and fourth?
🔍 View Solution
20 × 19 × 18 × 17 = 116280
Question 38
How many different ways can a tourist visit seven cities?
🔍 View Solution
7! = 7 × 6 × 5 × 4 × 3 × 2 × 1 = 5040
Content Locked / المحتوى مغلق
Please log in using an educational email in Qatar ending with .edu.qa to view this summary.
الرجاء تسجيل الدخول باستخدام بريد إلكتروني تعليمي في قطر ينتهي بـ .edu.qa لعرض هذا الملخص.